Community Reports
There are several reports you are able to run to gather information for your community. Each one of these reports gives you a tool for analyzying community member performance and development on the program's content.
Finding Reports
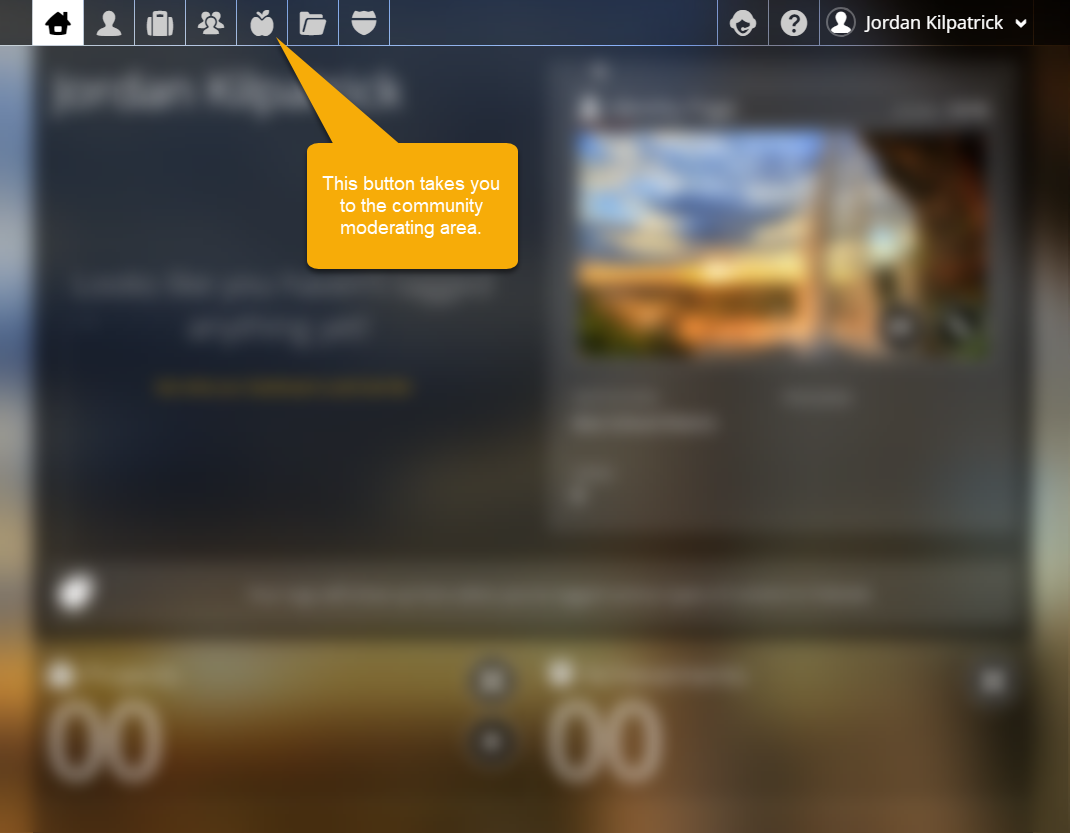
First you will need to go to the moderate communities page. Click on the Moderator icon to see a list of your communities.
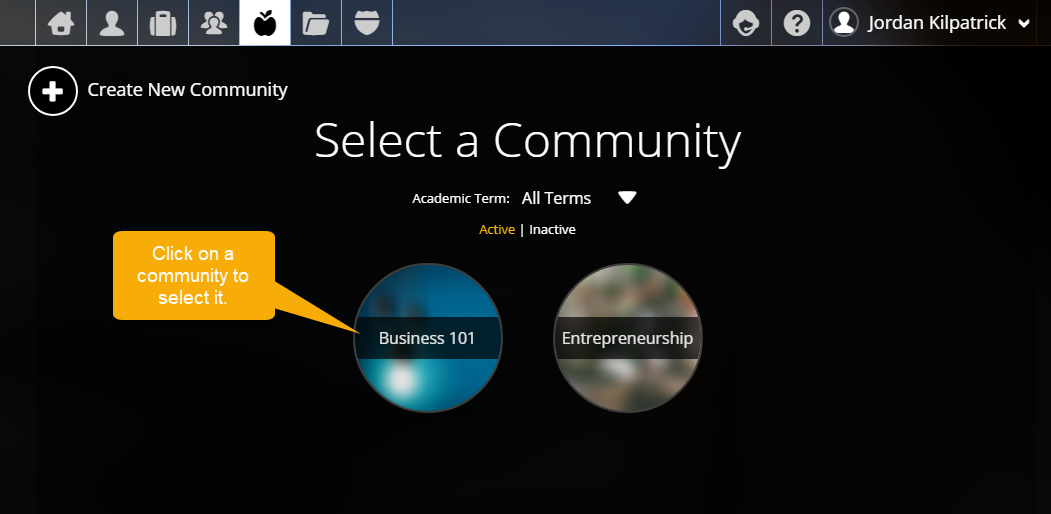
Next, choose the community you want to run reports on.
Once you have chosen a community you will be taken to the page where you can moderate your community. Click on the REPORTS tab. Here you will see the reports available to you along with a description of each. Depending on your institutions use of Foliotek features, some the reports shown below may not be available in your community.
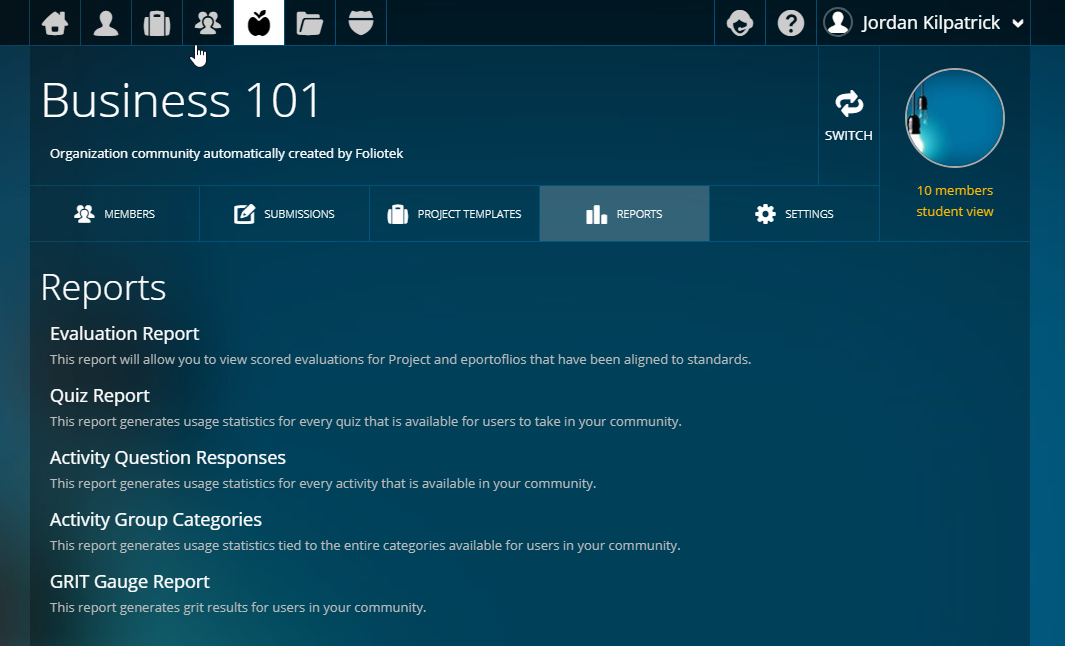
The Reports
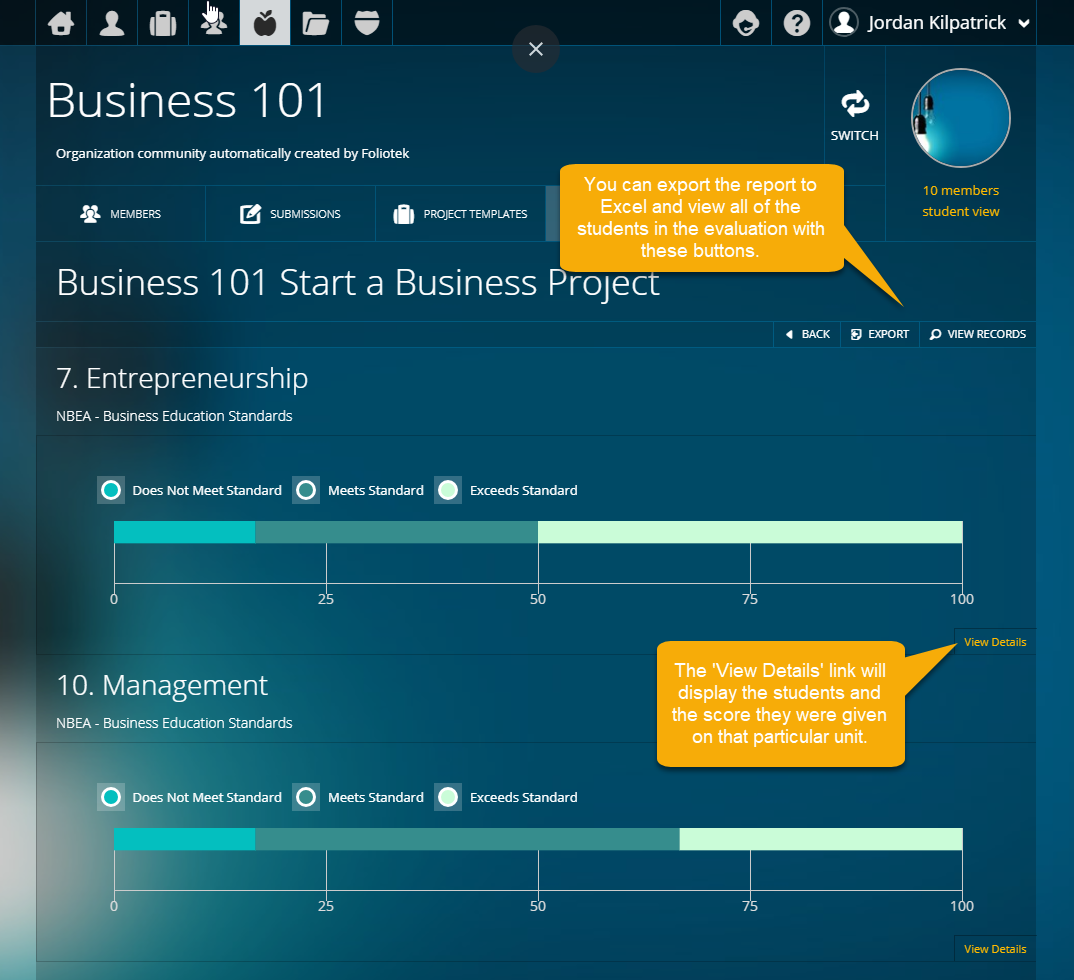
Evaluation Report
This report will allow you to view scored evaluations for Project and ePortfolios that have been aligned to standards. After selecting the type of template you want to report on, Project or ePortfolio, and choosing the specific template, the report will display a chart for each unit of the evaluation showing the scores awarded.
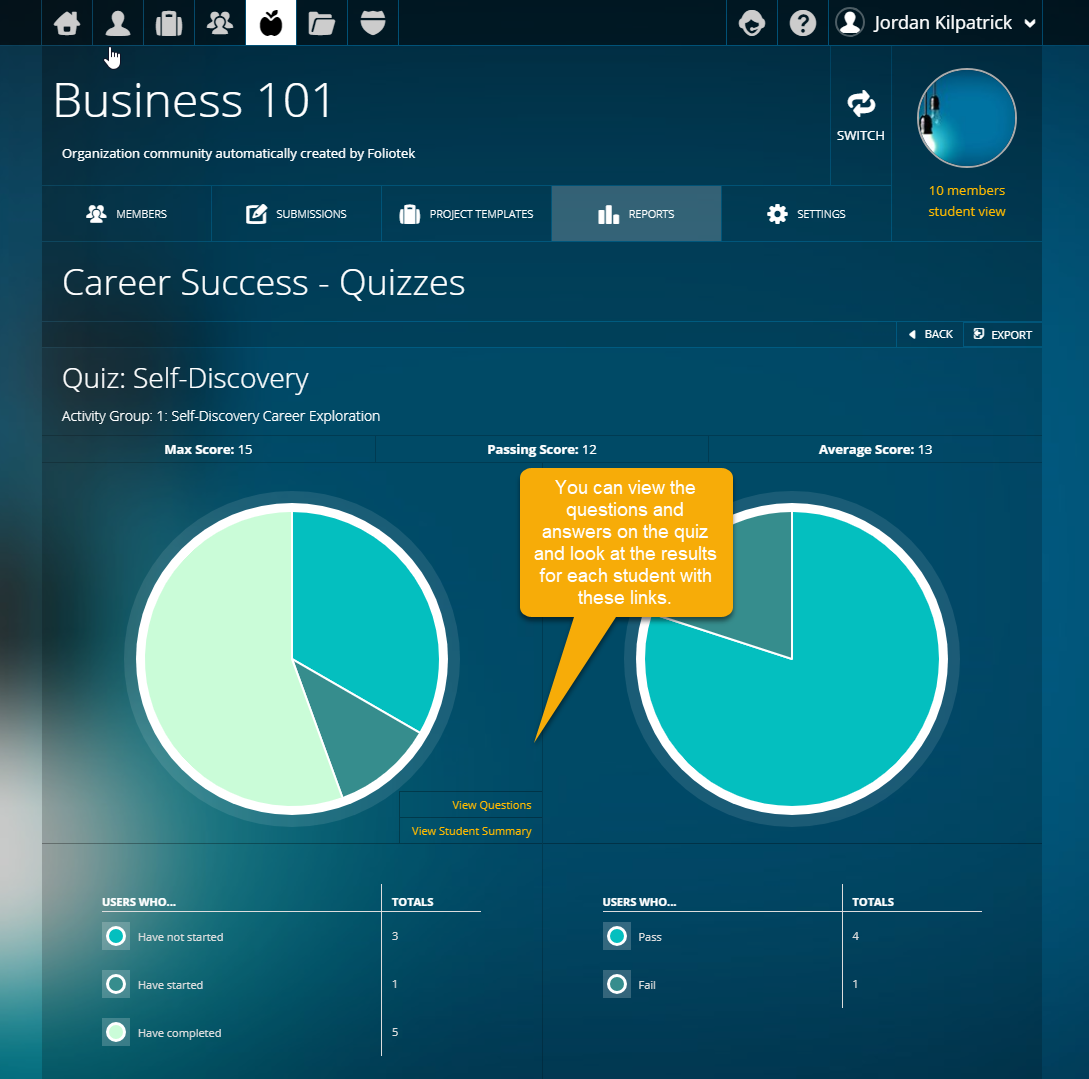
Quiz Report
This report shows the results of the quizzes present in a particular program and category. It displays the results for all quizzes in the selected category and allows you to view the questions on the quiz, the answers provided by the students, and shows the number of students who passed the quiz (if passing levels were designated for the quiz).
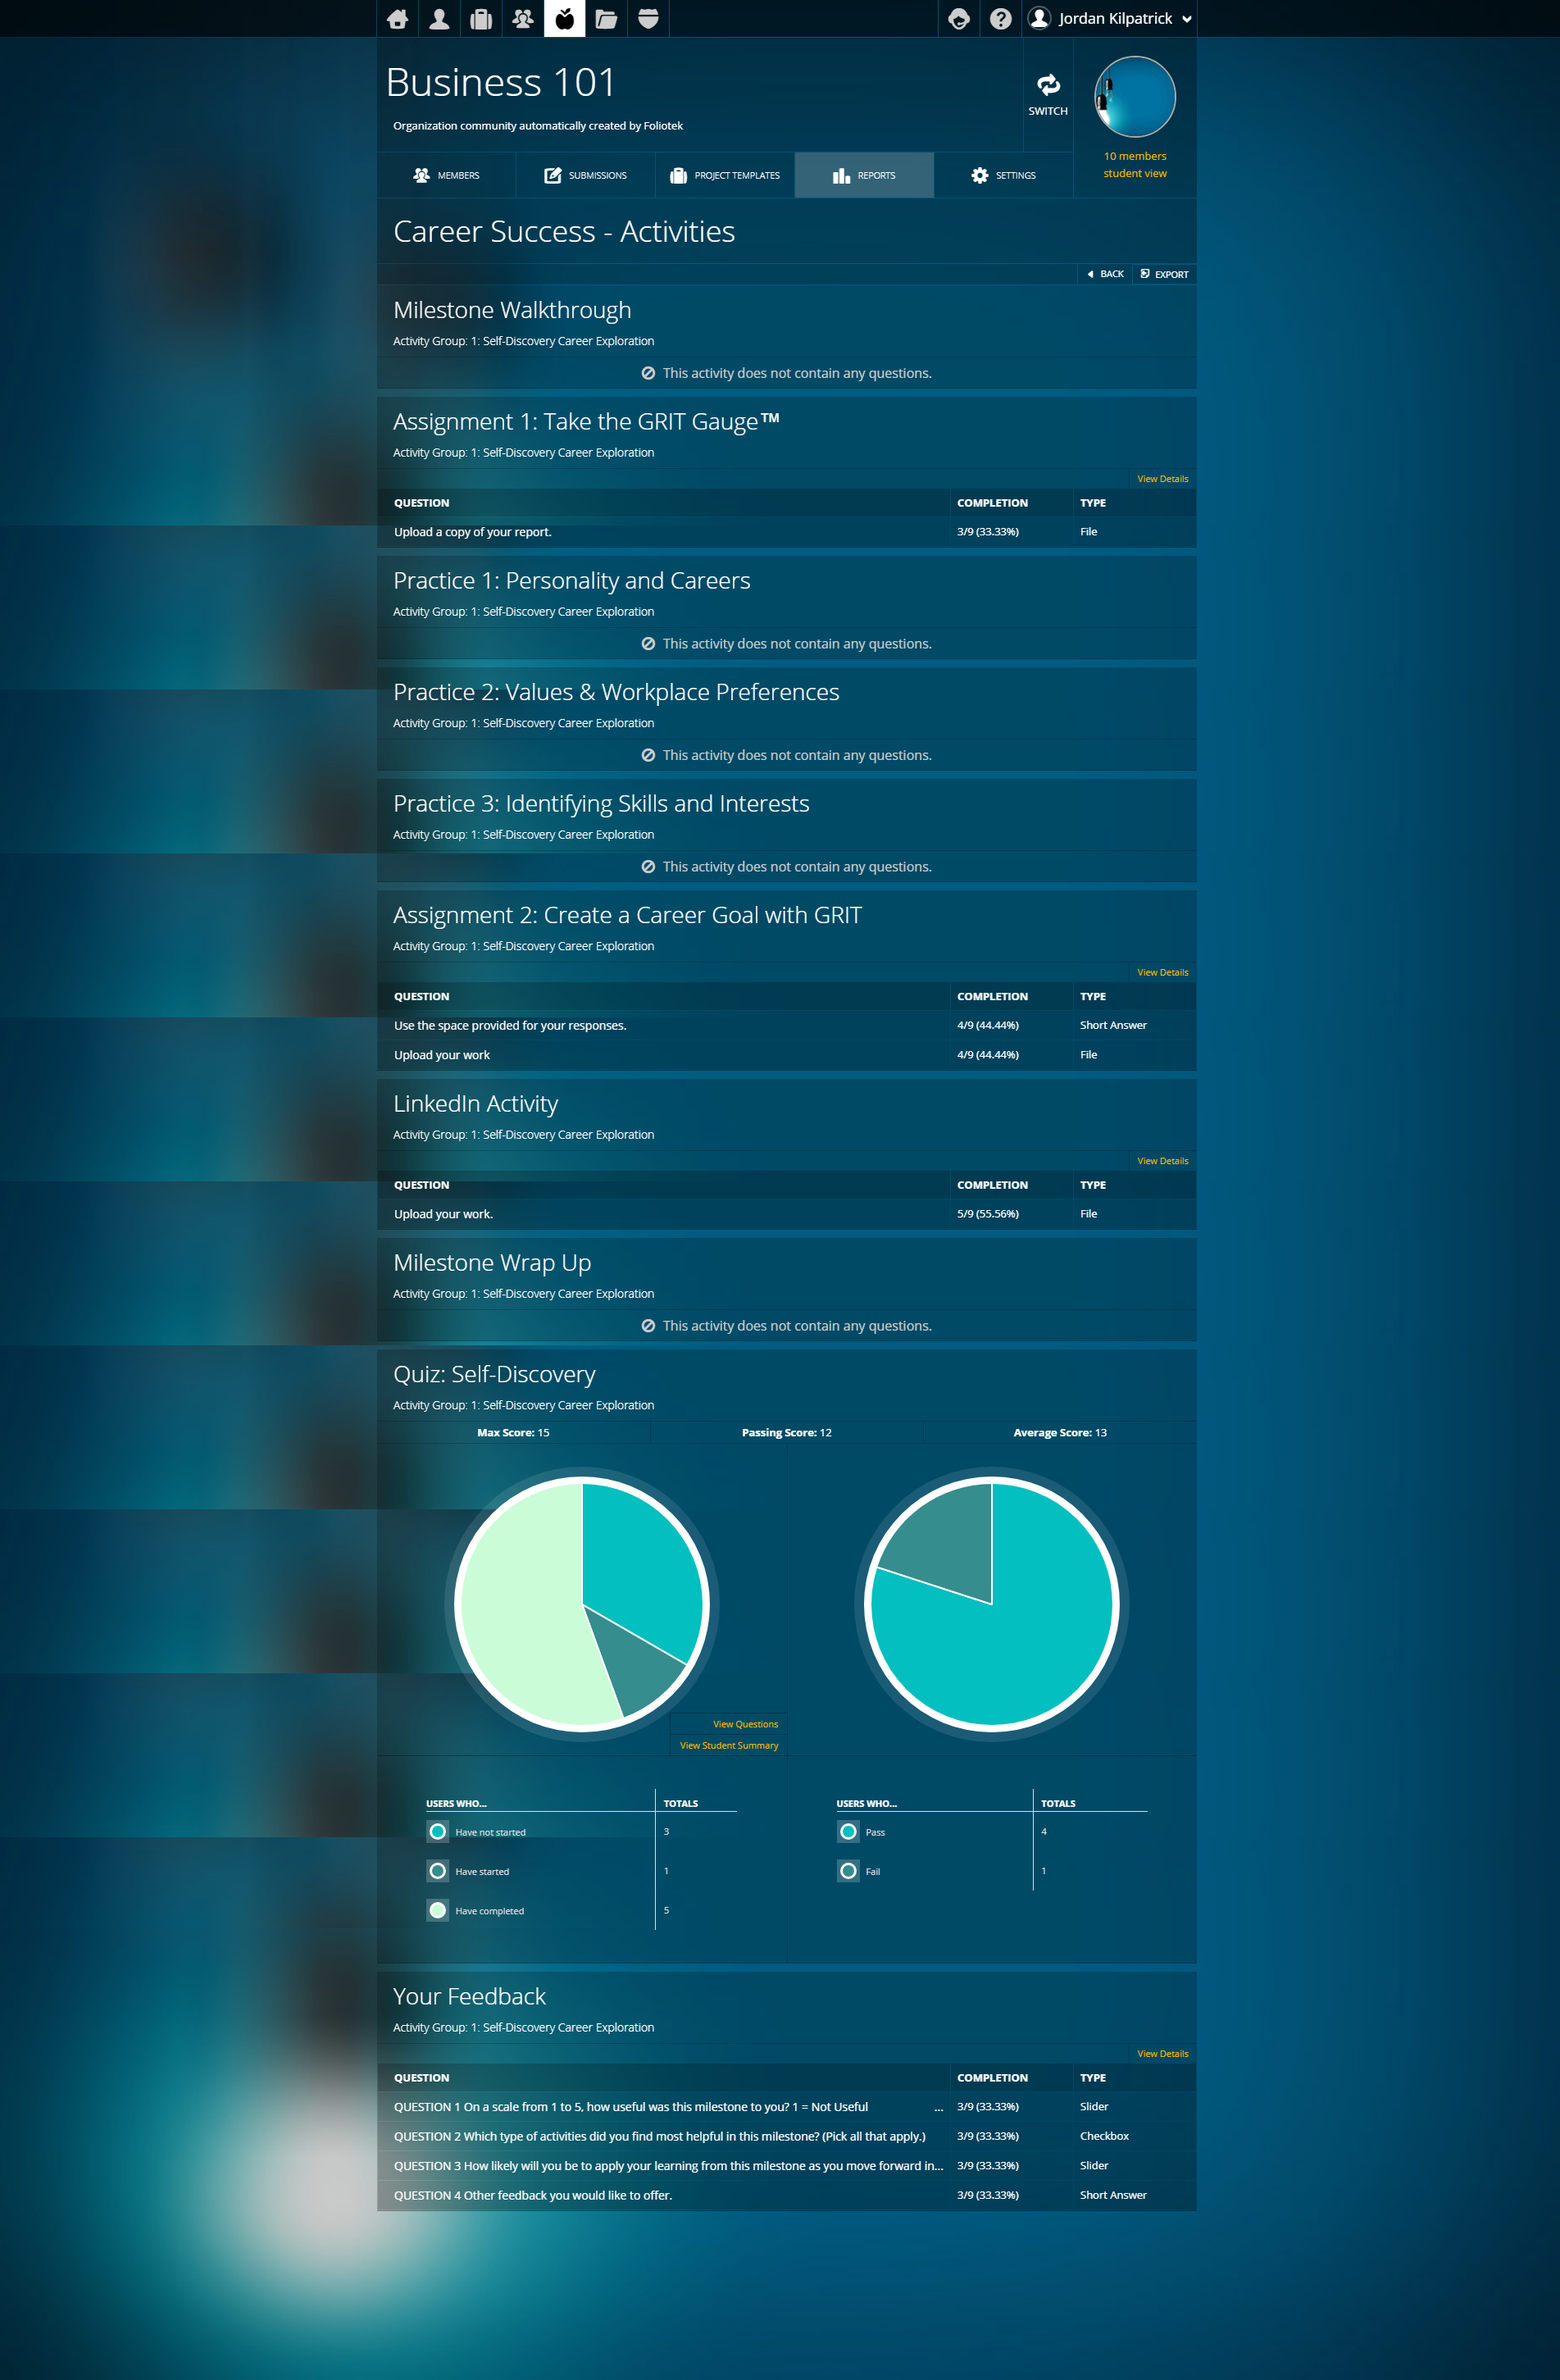
Activity Question Responses Report
This report allows you to collect data for all question types in an activity. It displays student responses to textbox, radio button, dropdown, checkbox, slider, and files questions; as well as continuing to give you access to quiz answers. After you select the program, category, and activity group, the report will compile the data for all students in the community from that program and provide access to the work or responses submitted by each student.
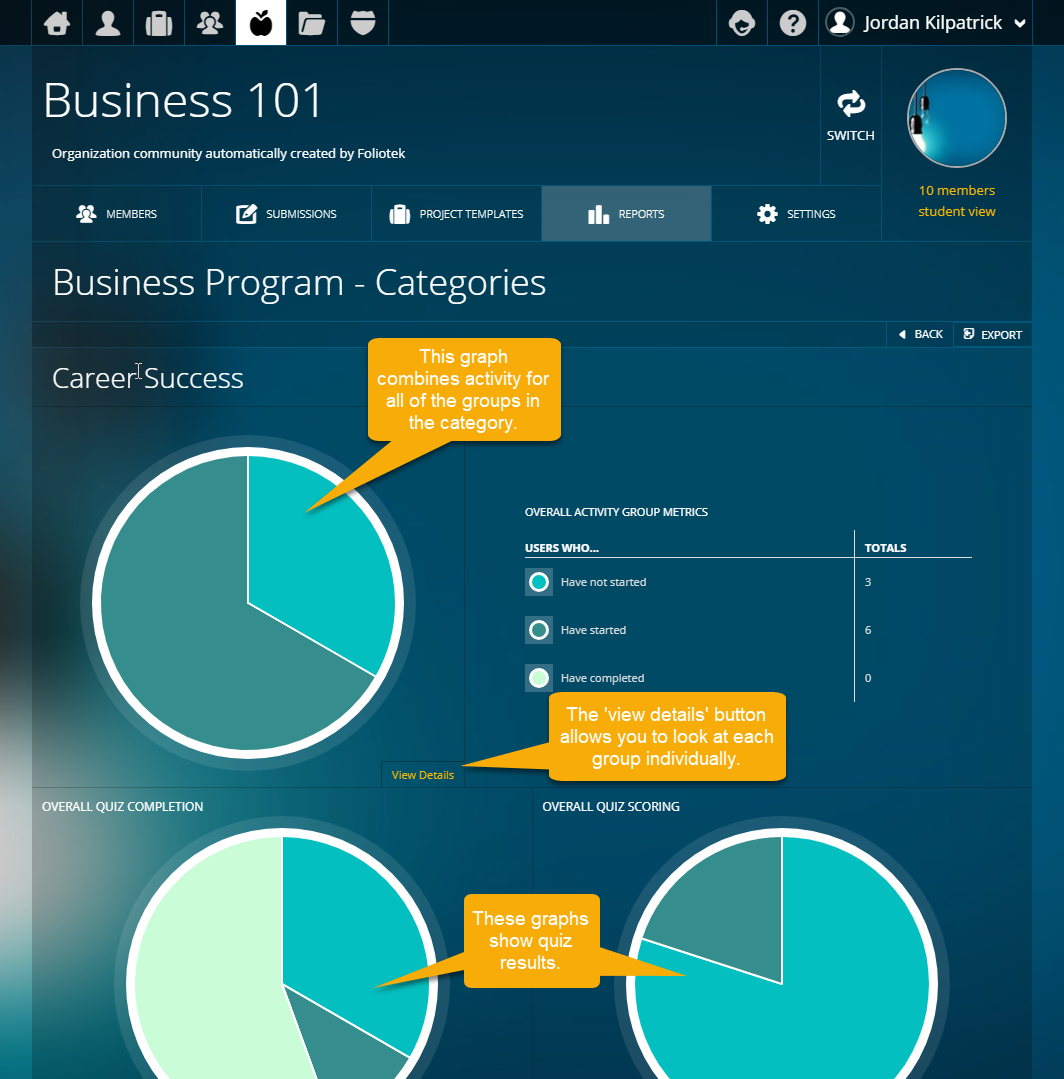
Activity Group Category Report
This report displays statistics related to the completion of all groups in a category. Selecting the Activity Group Category report allows you to select the program and category on which to run the report.
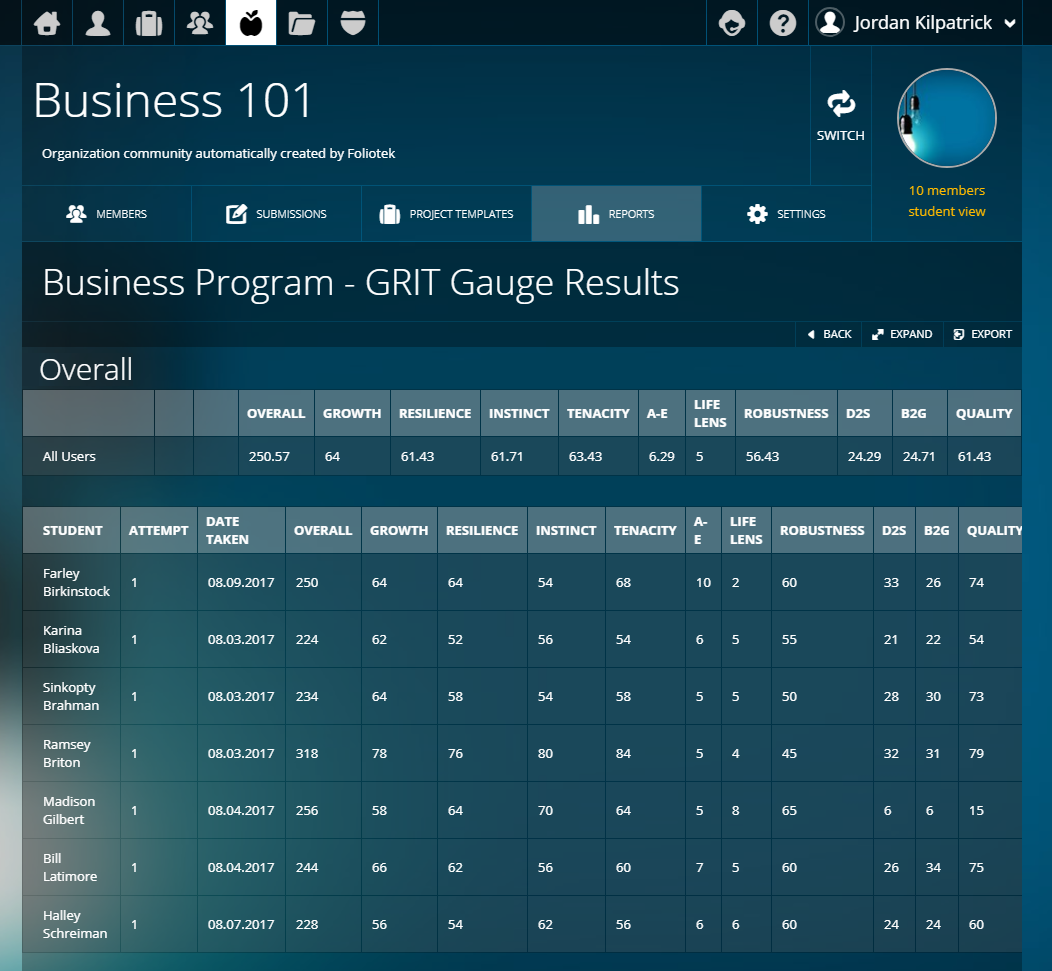
GRIT Gauge Report
This report generates GRIT results for the users in your community. For this report you will select the program, check which attempts to include, and set a date range to gather data from, if desired. The date range is not required. The report will then show you the overall score the students received and break the data down into other useful categories.
User Activity Report
The User Activity report displays valuable information on the activities students have been working on. It shows the completion of some basic student activity, such as files uploaded, logins, ID page completion, badges earned, quizzes completed, and projects created. It also provides more detailed information on the completion of activities and badges.
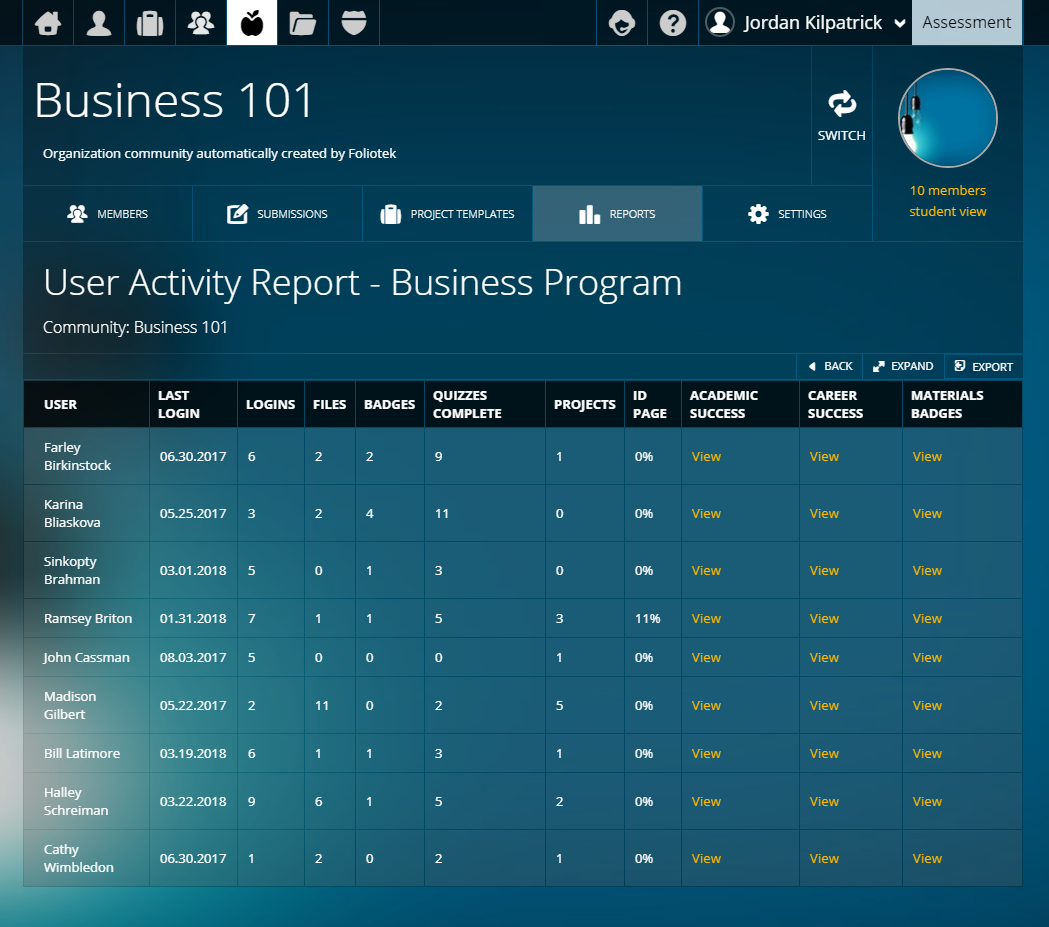
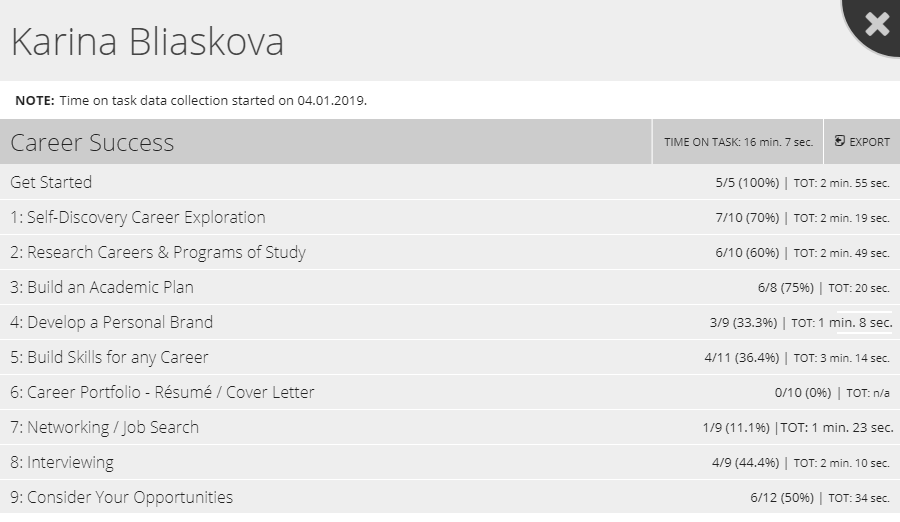
The report contains information on the Academic Success and Career Success categories and any categories that award badges. This includes data on the amount of time students spent completing each activity in the category. Clicking the 'view' link will open the detailed reports for that particular category.
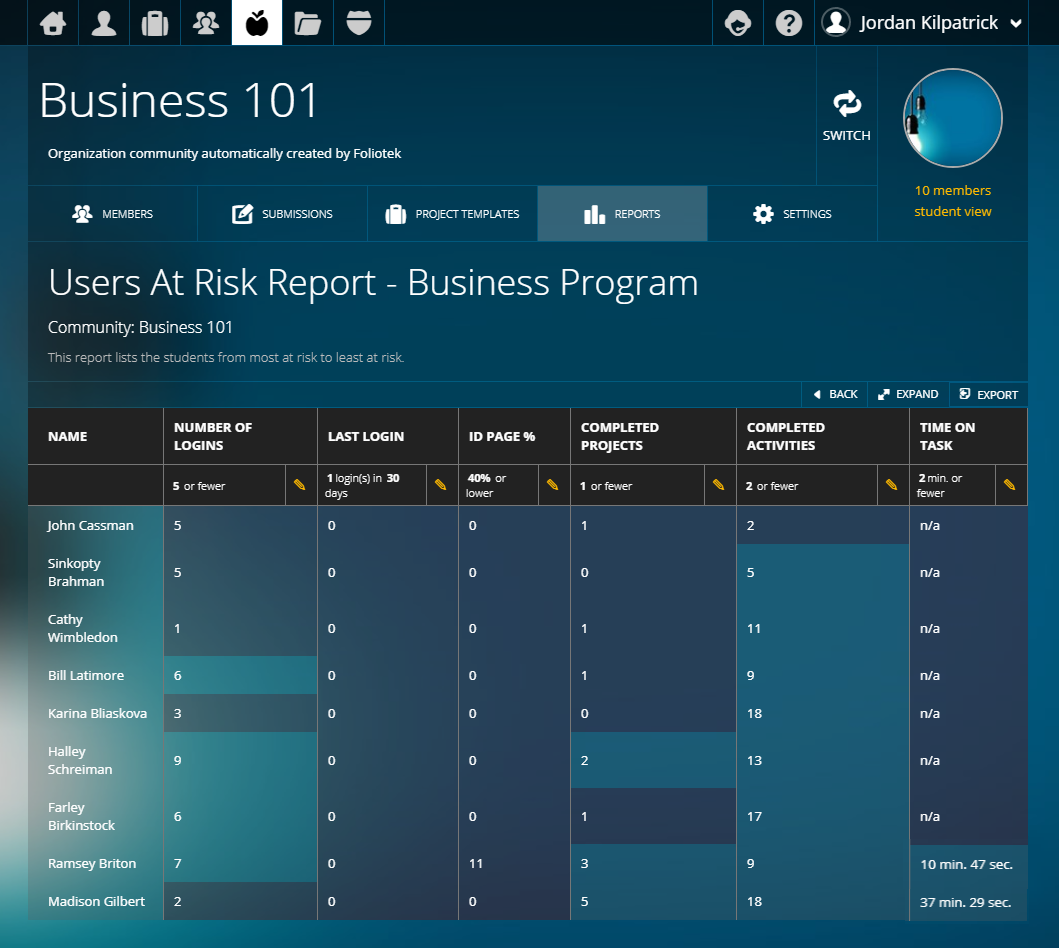
Users at Risk Report
The Users at Risk Report uses a specially designed algorithm combining number of logins, last login date, id page completion, projects created, activities completed, and time on task to identify students who are at risk of not being successful.